The Filing Is Out: Marking Our SpaceX Model to the S-1
In April we published a pre-filing valuation of SpaceX. We had no access to the company's internal financials. We built a sum-of-parts and three DCF scenarios from public disclosures alone, arrived at a $361.5 billion base, and called the gap to the reported $2 trillion target an optionality premium on unproven cash flows.
The S-1 landed on May 20. We now have audited segment data for the first time. This piece marks the pre-filing model to those figures. We treat the filing as a validation event, which means reporting what held, what moved, and which direction the number went.
The honest summary: the audited data lowered our number and widened the discount. Our thesis did not weaken. It strengthened.
What Held
Four inputs we estimated blind came back accurate.
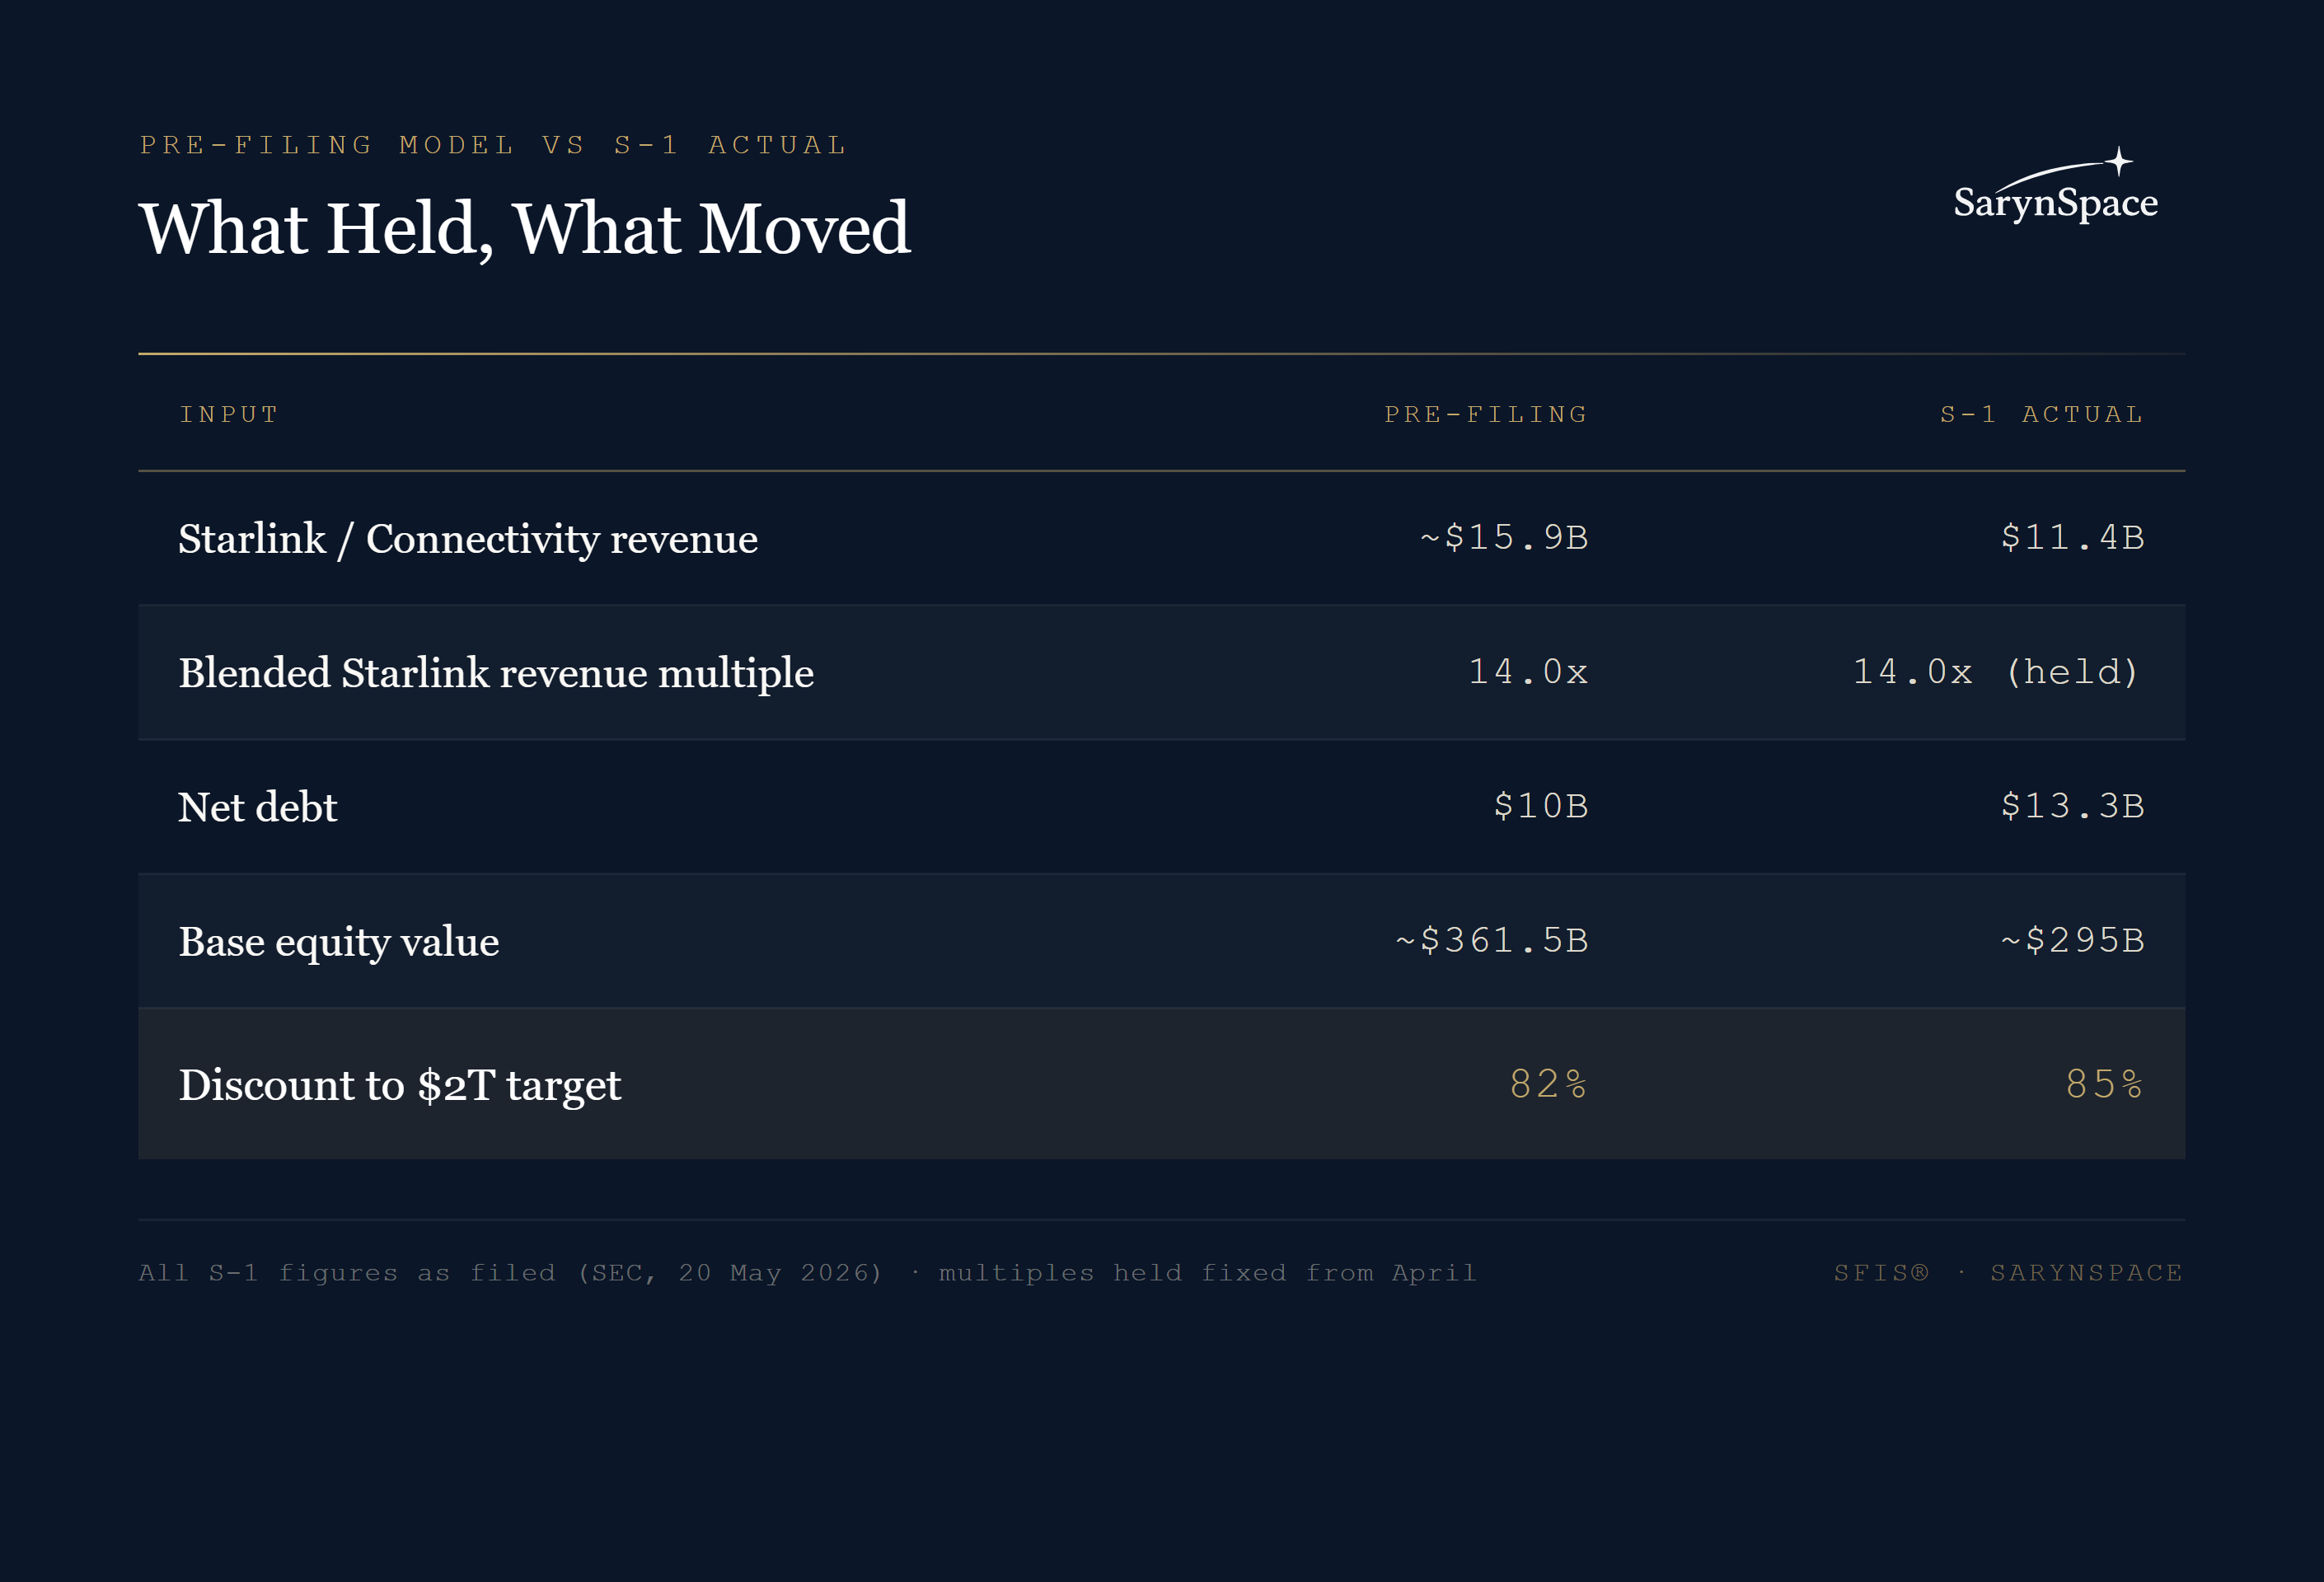
Starlink subscribers. We used roughly 10 million crossing in early 2026 and treated the 31 million 2027 forecast as a bull input, not a base. Disclosed: 10.3 million Starlink subscribers across 164 countries at March 31, 2026. The decision not to underwrite the 40 million market case was correct.
Constellation scale. We used a 10,000-plus satellite fleet. Disclosed: approximately 9,600 broadband and mobile satellites, around 75 per cent of all active maneuverable satellites in orbit as of March 31, 2026. Close, and we revise down.
xAI burn. We flagged roughly $1 billion per month. Disclosed: an AI segment loss from operations of $6,355 million in 2025, on segment revenue of $3,201 million and negative Segment Adjusted EBITDA of $1,237 million, with $7,723 million of AI segment capital expenditure in the first quarter of 2026 alone. Confirmed.
Credit structure. We argued SpaceX is investment grade on a standalone basis and compresses on the xAI consolidation. The segment data shows exactly that. Connectivity generated $7,168 million of segment EBITDA in 2025 while the consolidated entity posted a $2,589 million operating loss, driven primarily by the AI segment.
What Moved
Three inputs moved against the pre-filing model. None of them cancel.
Starlink revenue was overstated. Our sum-of-parts valued a Starlink revenue stack of approximately $15.9 billion across consumer, maritime, aviation, and enterprise. The disclosed Connectivity segment is $11,387 million for 2025. We carried roughly $4.5 billion of Starlink revenue that the audited statements do not support at the segment level. Because Starlink was the largest leg of our sum-of-parts, this correction does most of the work below.
Free cash flow margin was too high. We used a Starlink free-cash-flow margin of 78 per cent. The disclosed Connectivity Segment Adjusted EBITDA margin is 62.9 per cent for 2025. EBITDA margin is not free-cash-flow margin, but a 78 per cent free-cash-flow margin sitting above a 63 per cent EBITDA margin is not defensible once audited data exists. We cap the modelled margin at the disclosed 62.9 per cent. This input feeds the discounted-cash-flow cross-check, not the revenue-multiple sum-of-parts that produces the headline number below.
Net debt was higher than assumed. We used $10 billion net debt. The S-1 discloses total principal indebtedness of $29,132 million against $15,852 million of cash at March 31, 2026, for net debt of roughly $13.3 billion.
The Revised Number
The sum-of-parts values each segment on a fixed revenue multiple. The mark holds those multiples at their pre-filing levels and substitutes two disclosed inputs, Connectivity revenue and net debt. The bridge is revenue-driven. Margin does not enter it.
The pre-filing model valued four Starlink revenue legs, consumer, maritime, aviation, and enterprise, at a combined $15.9 billion of revenue and $222.5 billion of enterprise value, a blended 14.0 times revenue. The S-1 discloses Connectivity revenue of $11.4 billion for 2025. Holding the blended multiple fixed and substituting the disclosed revenue lowers the Starlink enterprise value to $159.3 billion, a reduction of $63.2 billion. That reduction is the whole of the mark. All other segments and the $23 billion Starship real option are held at their pre-filing values.
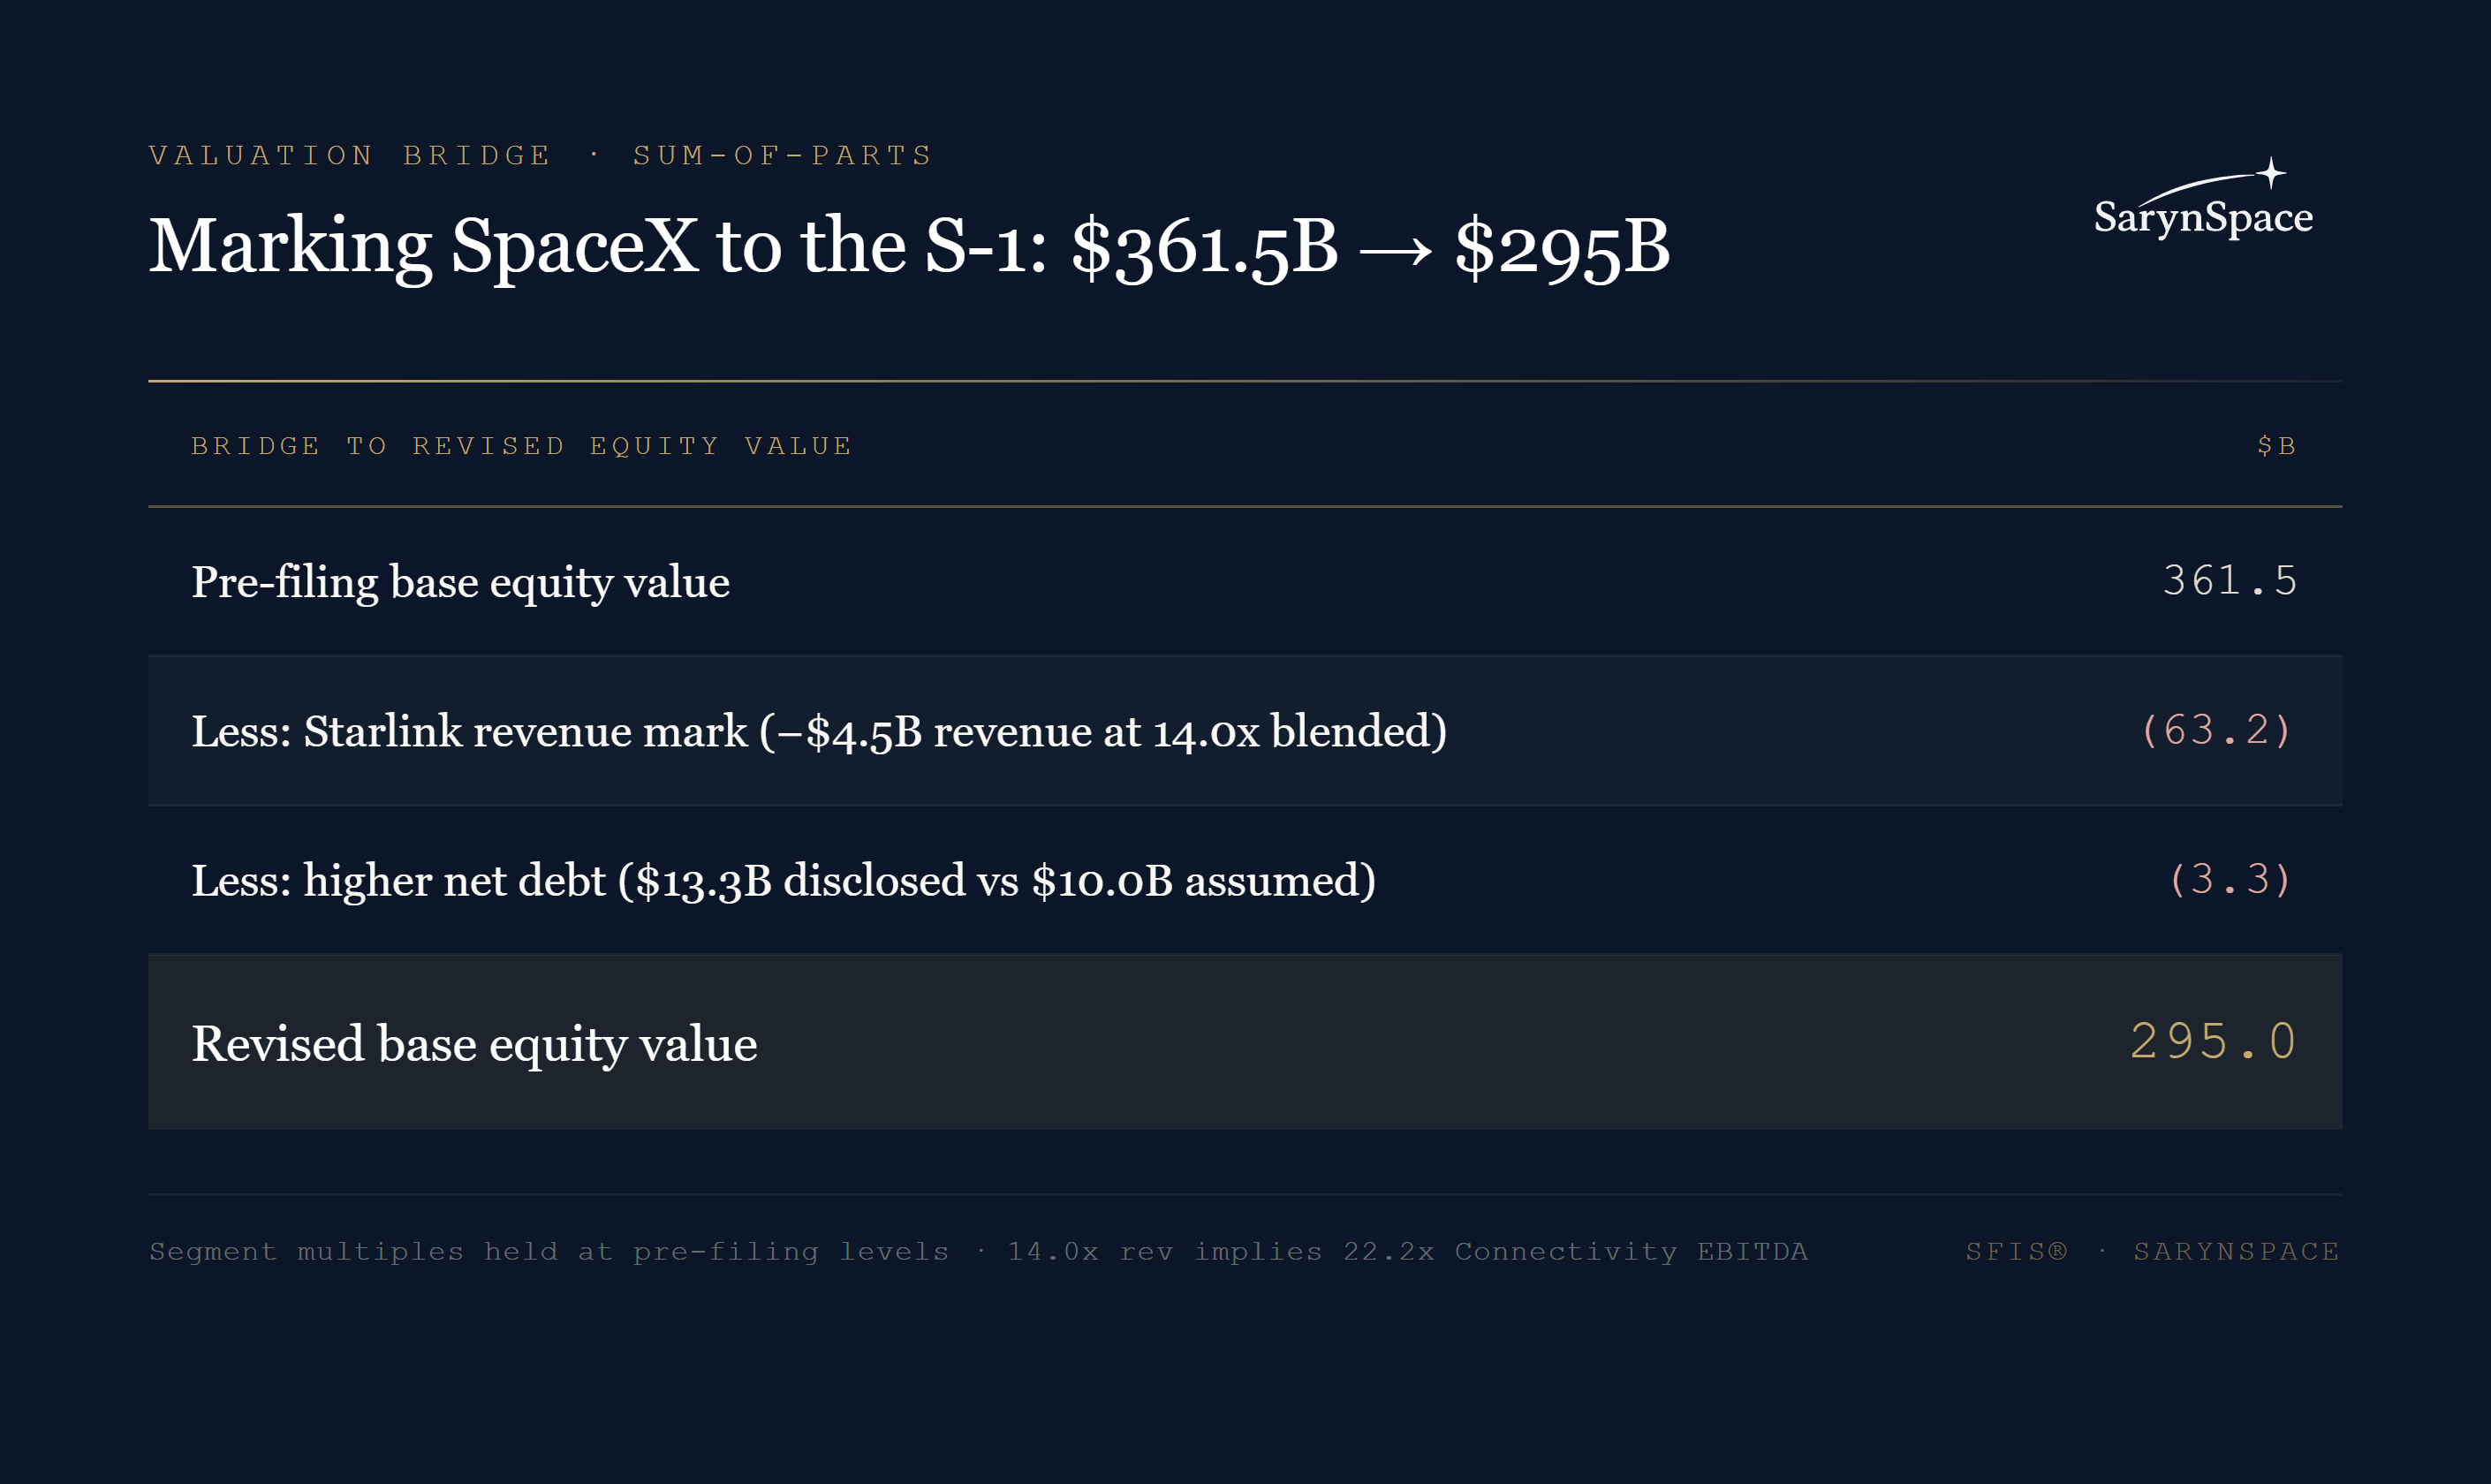
The blended 14.0 times revenue multiple, applied to disclosed Connectivity revenue of $11.4 billion, implies 22.2 times the disclosed Connectivity Segment Adjusted EBITDA of $7,168 million. The multiple is unchanged from April. Only the revenue base moved. Because Starlink is 64 per cent of gross enterprise value, a 28 per cent cut to Starlink revenue produces an 18 per cent fall in equity value.
The free-cash-flow margin correction does not enter this bridge. The sum-of-parts is a revenue-multiple valuation. The margin revision affects only the discounted-cash-flow cross-check, where we cap the modelled Starlink free-cash-flow margin at the disclosed 62.9 per cent, down from 78 per cent. That cross-check moves in the same direction and remains well below the target.
The audited data did not bring fundamentals closer to the market price. It pushed them further away.
Why the Discount Widening Is the Point
The gap is now approximately $1.7 trillion. It has not closed because none of the components driving it appeared in the financial statements as revenue. The S-1 confirms this directly. Orbital AI compute deployment is targeted to begin as early as 2028. Starship payload delivery to orbit is expected in the second half of 2026, with no commercial payload flown. The lunar and interplanetary initiatives are described in the filing as involving unproven technologies or technologies that do not yet exist.
So the structure of our original argument is intact and better evidenced. The market is assigning roughly $1.7 trillion of present value to an option set that the company's own audited statements show as pre-revenue and cash-consuming today.
Neither number is wrong. A valuation is a statement about what you are pricing and how you discount it. The $2 trillion target prices the option set: Starship at commercial scale, Starlink tripling its base, durable AI leadership, global direct-to-cell. Our $295 billion prices the cash flows the audited statements show today. The $1.7 trillion between them is not an error on either side. It is the value the market places on a future that has not yet been earned. The only question that matters for a buyer is whether the entry price compensates for bearing the risk that the future underdelivers. That is a question about risk-adjusted return, which is the discipline we apply.
The Risk the Filing Now Documents
Our pre-filing piece argued that SpaceX carries an uncollateralised debris liability across its fleet that no lender, insurer, or ratings agency has formalised into a reserve. The S-1 provides the documentary basis we did not previously have.
The filing states that the company does not typically obtain insurance coverage for its satellites, payloads, or launch vehicles, and as a result bears the full financial cost of any such losses. On the constellation it is more explicit. The filing states that it does "not maintain any" insurance "with respect to our in-orbit satellites, which we currently do not insure and do not expect to insure in the future." It also discloses that Starlink satellites performed over 1,000 automated collision-avoidance maneuvers per day in 2025. The risk factors then describe the failure mode in the same operating terms a credit model uses: satellites reach the end of their useful lives, are decommissioned, and must be replaced on a recurring schedule. That is a fleet-scale, uninsured, unreserved operating obligation against the largest constellation in orbit, with a replacement cadence the filing acknowledges in narrative and does not cost. It sits nowhere on the balance sheet.
Put in credit terms, the picture is a divergence. On the 2025 audited financials, consolidated leverage sits near 3.5 times consolidated Adjusted EBITDA of $6.6 billion, which is the $7,168 million of Connectivity segment EBITDA net of the AI and other segment losses, and interest cover near 3.4 times, which a conventional read calls investment grade on scale. By March 31, 2026, gross principal indebtedness had risen to $29.1 billion, lifting consolidated leverage to 4.4 times on the same $6.6 billion EBITDA base. Our deterministic credit model reads only this coverage and returns a one-year probability of default below 1 per cent. Our Bayesian model adds the orbital layer as a set of conditional risk nodes. The debris-reserve component scores the fleet at 2.28, above the 2.0 threshold for the high-risk state, and that node propagates through the financial-distress likelihood to lift the one-year probability of default to 11.7 per cent, with several hundred Starlink satellites in the highest live-risk band. The transmission is a hazard-rate adjustment, not a liability drawn against EBITDA. That is why the two views diverge: coverage stays investment grade while the orbital-adjusted probability of default reaches deep speculative grade. The uninsured, unreserved decommissioning and collision obligation is what the hazard adjustment prices and the coverage ratios omit.
The issuer makes the same point in its own risk factors. Against $29,132 million of total principal indebtedness at March 31, 2026, it states that its substantial indebtedness "may also adversely affect our credit ratings or outlook, which may increase our cost of capital." The company names the variable. It does not quantify it. This is the exposure conventional valuation frameworks do not price, and the reason a risk-adjusted cost of capital matters for any institution sizing exposure to the consolidated entity.
Position
SpaceX is operationally without peer. The S-1 confirms approximately 650 orbital launches, over 540 on flight-proven boosters, a single first-stage booster reflown 34 times, and an over 99 per cent Falcon mission success rate. No competitor reaches that cost structure or cadence within a credible five-year window.
Our revised figure of approximately $295 billion values that business on what it earns today. The gap to $2 trillion is the structured bet on the option set described above, none of it yet proven within a five-year window.
At a $2 trillion entry price, the buyer pays full value for that option set and bears the loss if it underdelivers. Our two internal methods converge on the same conclusion. The revenue-multiple sum-of-parts marks to roughly $295 billion. Our discounted-cash-flow base, run on the same disclosures, sits well below it. Both place the fundamentals roughly an order of magnitude under the target, and the difference is the bet. A widely circulated retail analysis reached a comparable order of magnitude by a conventional price-to-earnings route. We note it for breadth, not as corroboration.
SarynSpace produces orbital credit risk intelligence for institutional lenders, insurers, and infrastructure investors. SFIS® produces outputs used in WACC adjustment, Basel III capital reserves, and Solvency II SCR calculations. This article is not investment advice and does not constitute a credit rating.